Design Resource
Information Visualization of Harvesting Festival of India
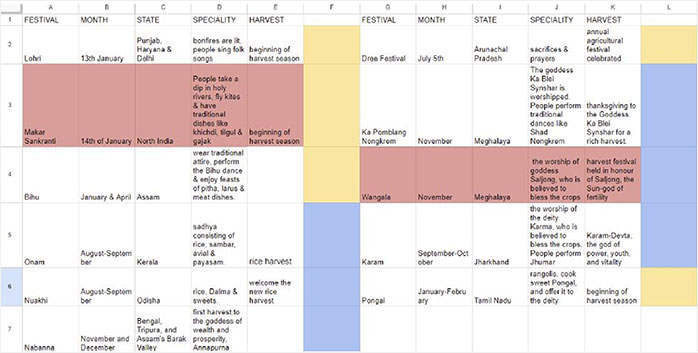
Traditions of different harvest festivals celebrated across India
by
Data Analysis
Following meticulous data collection, I embarked on a journey of in-depth analysis to unlock the rich tapestry of these harvest festivals. This analysis focused on several key aspects, allowing us to paint a comprehensive picture of each celebration.
Delving Deeper:
Our analysis addressed several key questions related to festival activities:
• Deities and Devotion:
I identified the deities worshipped during each festival, offering insights into the religious significance of the celebrations.
• Fasting and Feasting:
I explored fasting practices associated with some festivals, contrasting them with the celebratory feasts that mark the culmination of the harvest.
• The Rhythm of Rituals:
By mapping rituals based on the time of day, I gained insights into the flow and structure of festival activities.
A Sensory Experience:
We went beyond the rituals, taking note of the sensory experiences that define each festival:
• Visual Delights:
We documented the vibrant visual displays, such as colorful decorations or attire, that contribute to the festive atmosphere.
• Aromatic Allure:
The enticing aromas of traditional dishes being prepared were captured, adding another layer to the sensory experience.
• Sounds of Celebration:
I noted the music and songs associated with each festival, highlighting the role they play in creating a joyous mood.
Building a Framework:
This holistic analysis provided a structured framework for organizing the festival data. Two key elements guided this organization:
• The Festival Timeline:
Mapping out the sequence of rituals throughout the festival helped us understand the flow of events
• Thematic Threads:
I identified common themes across different festivals, such as deity worship, specific harvests celebrated, culinary traditions, and artistic expressions.
• Comparative Insights:
By representing festivals under a structure defined by these common themes, I was able to visually compare and contrast them. This approach revealed:
• Unique Flavors:
The distinct characteristics that set each festival apart, from specific rituals to regional variations.
• Shared Heritage:
The underlying themes and practices that bind these diverse celebrations together, showcasing the unifying spirit of India's cultural landscape.