Design Course
Visual Ethnography for Designers
Understand the design context
by
Data Analysis
Data can be broadly classified into qualitative and quantitative data. Qualitative data are the ‘thick descriptions’ gathered during study and can be interpreted to tell the ‘story’ about what was observed. Thick description involves reporting on explanations, inferences and interpretations of how the various data gathered in the field are related with each other. Thick descriptions also include your own reflections as a researcher on what was observed in the field, any biases experienced during the same etc. There are several ways of analyzing qualitative data such as content analysis, structural analysis, semiotic analysis etc. Sarah Pink talks about the role of self-reflexivity in gathering and analysing ethnographic data.
Quantitative data is collected from interaction & video logs and is presented as values, tables, charts, and graphs and treated statistically.
In order to conduct an interpretive data analysis, look for key events that drive the group’s activity. Identify patterns of behavior to understand the group better. You may want to test data sources against each other to ensure that the information you collected is authentic. This is known as triangulation. You can aim at producing ‘rich’ or ‘thick descriptions’ and reporting your findings as honestly as possible, while being sensitive to the community you studied. Including quotes, pictures, and anecdotes can make the findings come alive, instead of them being dry data. You can use software tools if the quantity of data gets too overwhelming to handle. Coloured markers, post-it notes and a white board can go a long way too.
Storytelling using Kaavad
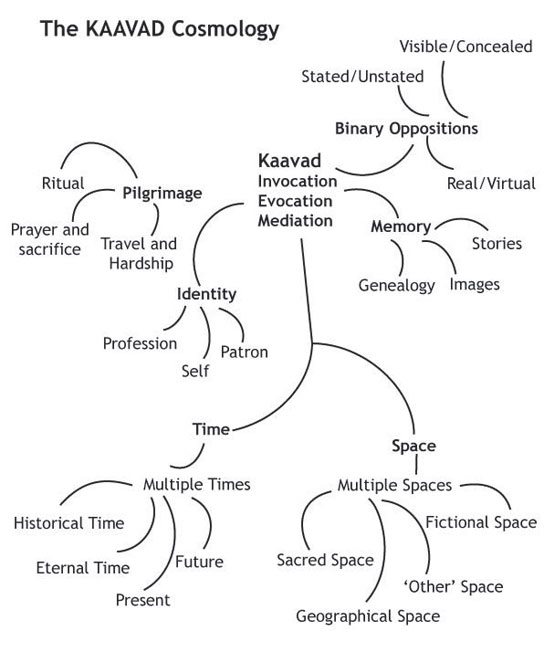
One can organise the flow of thoughts in the form of a mind map seen above.
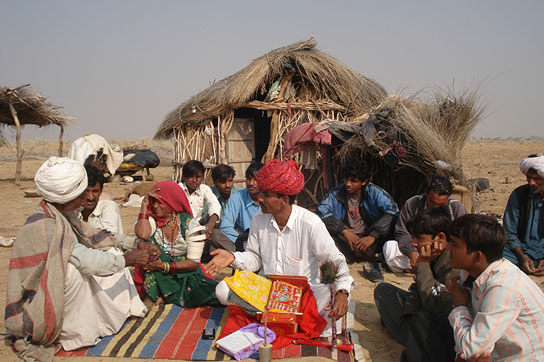
It is not just notes and recorded conversations that can be analyzed. Images whether created by the researcher or the participants of the study can be analysed using reflexivity. See Sarah Pink's book Doing Visual Ethnography for more on this. A photograph is not merely a proof that something happened. It can be interpreted in several ways depending on who is looking at it and what meaning is being invested into it.
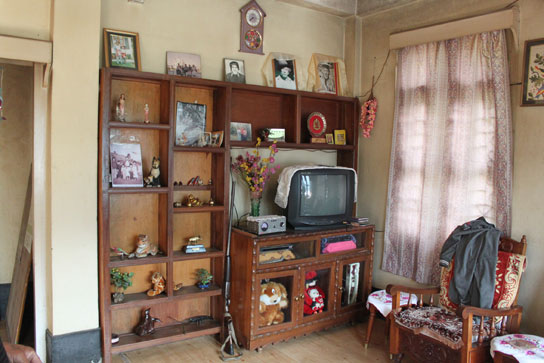
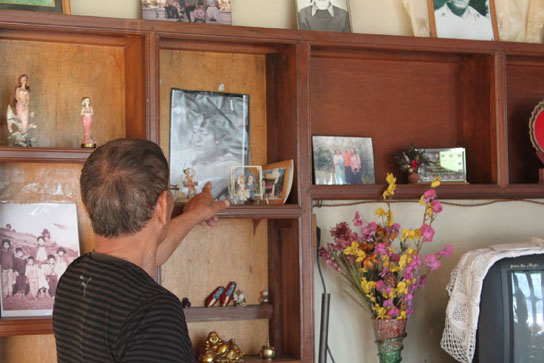
A look at items in the showcase reveals a lot about what the community member values. The analysis on an image cannot take place unless meaning invested both by the community member as well as researchers are looked into.
Picture Courtesy: P. Karthikeyan.